
Page contents
More information

User guide ProjectSheet (Pro)
Google Sheets add-on
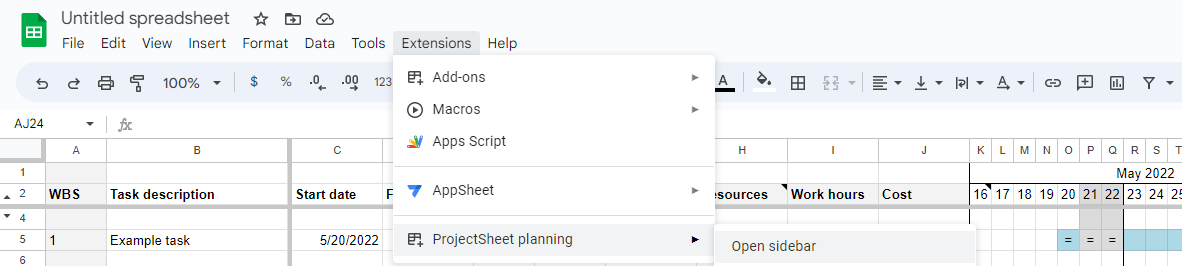
ProjectSheet is an add-on that provides a Google spreadsheet with WBS breakdown and a visual Gantt chart to plan and track a project. You can download the add-on from the Extensions menu in a spreadsheet or from the Google Workspace Marketplace
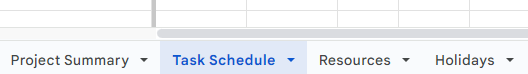
Once installed, the add-on creates the Task Schedule and Project Summary worksheets, and the Pro version also includes Resources and Holidays.
You can enter and edit the project data with the standard spreadsheet functions in combination with the add-on features in the sidebar. Unlike the standard spreadsheet functions, the add-on functions cannot be undone (Ctrl+Z).
Opening the sidebar is done using menu Extensions > ProjectSheet planning > Open sidebar. You can close the sidebar by clicking on X at the right top.
You can provide all empty or copied Google spreadsheets with ProjectSheet from menu Extensions > ProjectSheet planning > Add ProjectSheet. In case of an empty spreadsheet, wait until the sheets are completed.
Customization
The spreadsheet can be customized, but within restrictions because of ProjectSheet functionality:
| do NOT | do |
| change or extend the Gantt chart in the sheet itself | adjust the Gantt timescale with settings in the sidebar |
| delete ProjectSheet columns | hide ProjectSheet columns |
| protect sheets and ranges against editing | share spreadsheet for viewing only |
| copy ProjectSheet columns | insert Custom columns/headers left of the Gantt chart |
| change header rows, including hidden row 3 | change ProjectSheet and Custom column order |
| delete ProjectSheet worksheets
copy ProjectSheet worksheets in the same spreadsheet |
add Custom worksheets |
ProjectSheet columns are the Task columns and Resource columns (Pro).
Custom columns and worksheets you add yourself.
See here how to edit the rows and columns of a Google spreadsheet:
Add or move columns & cells
ProjectSheet renumbers the WBS when you move, remove, erase or copy tasks.
Authorization
As soon as you start using ProjectSheet for the first time, Google gives an authorization screen. Here you can see that the add-on modifies the spreadsheet and that it requires access to an external service because of the Pro functionality.
Uninstall
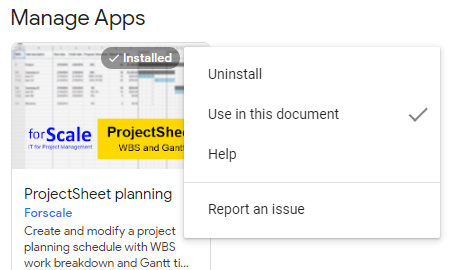
If you do not want ProjectSheet anymore in a certain spreadsheet, you can disable it at menu Extensions > Add-ons > Manage add-ons. It opens a dialog with all your add-ons. Select the ProjectSheet options and un-select 'Use in this document'. After you did this you can delete the tabs without rebuild. In the same menu you can 'Uninstall' ProjectSheet completely from all your spreadsheets.
Task schedule
The Task Schedule worksheet consists of a table on the left and an accompanying Gantt chart on the right.
Each column in the table has a header indicating the type of information in its column. The header titles can be customized to for instance a different language. The order of the present columns can be changed and custom columns can be inserted.
A row represents a task as soon as it is described in column 'Task description'. Removing the description will remove the task and make the row empty. Rows may remain empty for readability. Use normal spreadsheet functions to insert, clear, delete or copy rows.
Summary task
A task is a summary task as a result of the Work Breakdown Structure (WBS). A summary task has subtasks and only requires a Task description. Start date, Finish date, Progress, Work and Cost are calculated as a result from its subtasks. Summary tasks have their row text in bold.
Milestone
A milestone indicates an important moment in the schedule. It is a task that only has a finish date, the start date is left empty. In the Gantt chart a milestone is visible with a different color than normal tasks and summary tasks.
In the Pro version a milestone has a duration of 0 days.
Gantt chart
The Gantt chart is positioned right from the task table in the Task schedule sheet.
Timescale
The Gantt chart has a timescale at the top. The default time scale covers a total of 13 weeks. For projects that last longer, the start date of the timescale can be shifted to see parts of the project. With ProjectSheet Pro you can change the timescale unit from days to weeks, months or years to see the the entire project at once. With Pro you can also set the timescale automatically to show the entire project.
Task bars
The Gantt chart shows each task with a horizontal bar from its start date to its finish date inside the timescale.
Summary task, normal task and milestone bars have different default colors. The color of a task bar follows the background color of the Task description cell if Gantt bar with progress color is disabled and a background color other than white is selected.
Today indication
If today's date falls in the timescale, a vertical dashed line indicates this date.
Progress indication
The progress percentage of a task is translated into a double line in the task bar in the Gantt chart. If this double line stops before the current date indication, this means project delay.
Task columns
The task columns are in the Task sheet.
WBS
This column is read-only and states the WBS (Work Breakdown Structure) code per task. Changes in the WBS (like inserting tasks) may result in renumbering of WBS codes. Changing a task's level of indent is done by WBS functions in the sidebar.
The code consists of steps divided by dots. Step numbers consist of consecutive numbers starting at 1. The amount of steps equals the level of the WBS code. Codes having an equal start belong together.
Example:
| 1 | Summary task A |
| 1.1 | Task B |
| 1.2 | Summary task C |
| 1.2.1 | Task D |
| 1.2.2 | Task E |
| 1.3 | Task F |
Tasks B, C and F have the same level. They each have two steps.
Tasks D and E belong to the same summary task C, they share the same first two steps.
The WBS column is read-only. The WBS code of all tasks are re-calculated automatically after each affecting change.
Task description
The task description is the starting point of the schedule. The description states what needs to be done or what needs to be delivered. The text will indent according to its WBS level. Notes can be added to a Task description by using the right mouse click menu.
Newly added tasks will automatically get a WBS code with the same outline level as the previous task. A task and its WBS code will disappear entirely if its description is deleted.
Start date, Finish date
These columns contain the start date and finish date of each task. These dates are shown as a bar in the Gantt chart if they are inside the timescale.
Summary tasks receive their dates from their subtasks, they cannot be entered.
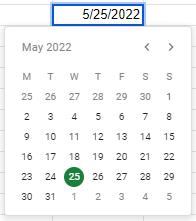
Double-clicking an entered date gives a calendar pop-up to adjust the date.
Progress
The progress of each task is entered in %.
Summary tasks calculate the progress of their subtasks, there is no need to enter them. For the Pro version the progress is weighted with the Days task durations, for the free version with the differences between Finish and Start date.
In combination with the corresponding setting in the sidebar the progress results in a color.
| Condition | Color |
| today before task start date | no color |
| today after task start date and progress on schedule | green |
| today after task start date and progress behind schedule | yellow |
| today after finish date and progress less than 100% | red |
| progress equals 100% | no color |
Days (Pro)
The task duration is entered in working days. Two weekend days are taken into account and are not counted in the duration and proceed the week start day as selected in the sidebar.
The finish date follows a change in the duration. The duration follows a change in the finish date. Work hours follow duration days with 8 hours per day if they are coupled with this option in the sidebar.
Removing the duration removes the start and finish dates.
Summary task days cannot be entered, they are calculated based on their start and finish dates.
A duration of 0 gives a milestone.
Link (Pro)
Tasks can be linked:
| none | not linked |
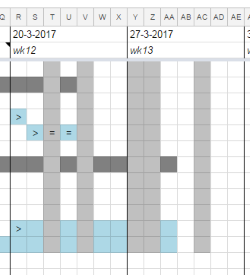
| chain | start date follows finish date of its previous task in the WBS under the same summary task; this is indicated with '>' at the start of the Gantt bar |
| fixed | start date is fixed and will not shift with its summary task; this is indicated with 'X' at the start of the Gantt bar |
Work hours (Pro)
Enter here the hours for a task. A summary task adds the hours of the underlying subtasks.
In the sidebar there is an option to link Work hours to Days task duration, under Adjust working time. If unchecked, the work hours needs to be updated manually. If checked, changing one will also update the other.
Resources (Pro)
The assigned resources. A resource can be of type work, equipment or material, as indicated in the Resources sheet. The quantity per resource is stated after each resource between [ ], except for 1 which can be omitted. Examples:
| R | corresponds to 100% availability (work) or 1 unit (material) |
| R[1] | corresponds to 100% availability or 1 unit |
| R[0.5] | corresponds to 50% availability or 0.5 units |
Assigning multiple resources is indicated by separating them by a semicolon. Example:
| R1;R2[0.5] |
When assigning work resources, the Work hours will not change, the Days duration follows the Work hours and availability. The duration is equal to the Work hours divided by the hours per work day as set in the sidebar under 'Adjust working time' (default 8 hours). Assigning multiple work resources to the same task will keep Work hours the same and shorten the Days duration.
A resource is automatically added to the Resources sheet or adjusted if already present.
Cost (Pro)
The cost per task, calculated from the assigned resource quantities and the cost per resource. The work hours per task are valid for each assigned work resource separately or are divided amongst the assigned work resources based on availability.
Cost per work resource = assigned availability / total assigned availability * Work hours * Rate per hour
Cost per equipment resource = assigned quantity * Duration hours * Rate per hour
Cost per material resource = assigned quantity * Rate per unit
A summary task aggregates costs of its underlying subtasks. Costs of the summary task itself are also added.
User defined column
A user defined column can contain any information. Also cell formulas can be applied for dedicated calculations.
Resource columns (Pro)
The resource columns are in the Resource sheet.
Resource name
Descriptive name of the resource. A resource will disappear entirely if its name is deleted.
Type
A resource can be a work (default), equipment or material resource. The cost calculation of an assigned resource to a task depends on the resource type. A work resource is counted per work hour, equipment per duration hour and material per unit.
Rate per resource
Cost for a resource across all tasks per hour or unit.
Total count
All work hours or units assigned to a single resource across all tasks.
Total cost
All cost of a single resource across all tasks.
Project summary
The Project Summary worksheet contains the data that applies to the entire project, as a top level WBS summary task. The data corresponds to the (Pro) columns of the same name in the Task Schedule worksheet. Added to it is the Remaining work which is a combination of Progress and Work.
Holidays sheet (Pro)
In the Holidays worksheet free dates can be noted that cause delay to the project schedule. Each row contains the date for one day. The date applies to all resources at once.
Press Refresh in the sidebar to make the holidays take effect in the schedule.
The non-working dates are shown in the Gantt chart as vertical gray columns when the Gantt scale has 1 day per column. With other scales the holidays are not shown, but they are taken into account for the schedule.
Translation
The English version of ProjectSheet can be translated into another language using Google Translate. You can check your language with the translate checkbox, see picture below. If your language is included, the translation will start, otherwise you can send a request. When you un-check the checkbox, the translation will be undone.
![]()
You can modify the translated text in the column headers of a worksheet directly. The translations in the menu and sidebar come from a hidden worksheet called TRANSGOOGLE. The original text is in column A, while the translated text is in a column to the right, you may need to scroll to it. You can modify the translated text, which becomes active when you refresh the browser.
Please contact Forscale in English if needed.
Sidebar
The side bar contains functions for editing the schedule and for changing settings, both in their own tab. Some functions are only available for the Pro version, indicated below in parentheses. During a trial or license Pro will appear in the black title bar after ProjectSheet and in case of the trial also the remaining number of days in parentheses.
Some functions require that one or more tasks are selected first before choosing a function in the sidebar. Selection can be done per row at the left margin of the sheet or by selecting any cell in the task row. Only adjacent rows can be selected, not multiple selections.
The sidebar can be closed with X in its black title bar. The sidebar can be opened again in the add-ons menu of the spreadsheet.
Pro info
A dialog will open to start a 10-days trial with the Pro features or to activate/extend the Pro license after your PayPal purchase. When started the dialog shows the remaining time.
FAQ and Support
A new tab will open with these pages.
Refresh
This function at the bottom of the Sidebar recalculates the WBS codes and the Gantt chart. In some cases they are not automatically updated after changes.
Edit
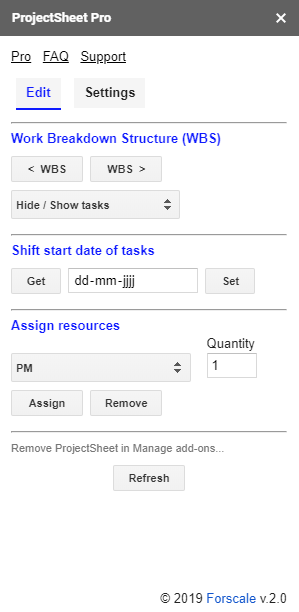
Edit Work Breakdown Structure
< WBS WBS >
This function decreases / increases the level of the WBS code and the amount of indent of the task descriptions of the selected tasks.
For example WBS 1.2.2 becomes 1.3 or WBS 1.3 and 1.4 become 1.2.1 and 1.2.2.
Hide / Show tasks
collapse selected task(s) / expand selected task(s)
All subtasks of the selected summary task(s) are hidden / shown.
Selecting multiple summary tasks can only be done by selecting adjacent rows in which they fall,
not by using multiple selections.
collapse all summary tasks / show all tasks
Only summary tasks are shown / all hidden tasks are shown again.
hide 100% completed tasks
Hide all completed tasks.
Show them again with 'show all tasks'.
Shift start date of tasks
Shift non-summary tasks in time, adjusting their start and finish dates.
- Select adjacent task(s) you like to shift. Selected summary tasks cannot not be shifted themselves, but will follow their shifted subtasks.
- Choose Get in the Sidebar to show the earliest start date of the selected task(s).
- Enter the new earliest start date in the calendar.
- Press Set to shift the selected task(s) accordingly.
In order to see the shifted tasks in the Gantt chart, it may be needed to change the start date of the timescale.
In the Pro version chaining comes before shifting, and shifting always results in a working day.
Assign resources (Pro)
This function in the Sidebar assigns resources to the selected task(s).
- Select adjacent task(s) in 'Task schedule' sheet.
- Choose required resource in pull-down or add a new resource.
- Enter the required Quantity or leave empty for 1.
- Press Assign button or Remove button.
Settings
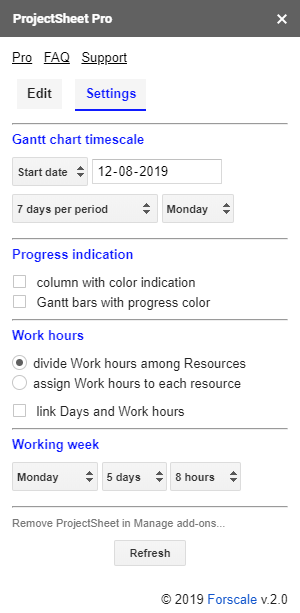
Gantt chart timescale
start date
The start date of the timescale can be:
- today
- earliest start date of the selected task(s)
- chosen date
In case of a week scale the start date will be the first start day of the work week before the chosen date.
timescale (Pro)
The timescale consists of 70 columns. A column can last 1-18 days according to the table below.
| Column | Timescale |
| - | show entire project |
| 1 day | 7 days per period |
| 1 day | 1 week per period |
| 2 days | 2 weeks per period |
| 3 days | 3 weeks per period |
| 4 days | 4 weeks per period |
| 6 days | per month |
| 7 days | week numbers |
| 9 days | 1,5 year per timescale |
| 12 days | 2 years per timescale |
| 15 days | 2,5 years per timescale |
| 18 days | 3 years per timescale |
start day of work week
The first day of the work week can be set to Sunday or Monday. Monday is the default setting.
Progress indication
column
When selected, the background color of the Progress cell indicates progress status.
Gantt
When selected, the Gantt bar color indicates progress status.
Work hours (Pro)
You can assign the work hours of a task among the resources or per resource.
- Dividing the work hours over the resources is desirable if the resources do the same work. More resources means that the work hours are divided over the resources depending on the allocation, which is enclosed in brackets after the resource.
- If the resources allocated to a task do different work, it is desirable to allocate the work hours to each resource individually. With the assignment, which is enclosed in brackets after the resource, it is then possible to vary the hours allocated to a task per resource.
Task duration and Work hours can be set independent or follow each other with the set working hours per day. The option takes effect on changes and on new tasks only.
Working week
Set the working week by selecting
- start day of the working week
- number of consecutive working days per week
- working hours per day (Pro)
The non-working days are gray columns in Gantt charts that have a scale of 1 day per column.